Case 03 / 04 · 2025
J&D Power BI CI/CD
CI/CD for a Power BI report — the .pbip project version-controlled, automatically quality-gated, and promoted dev → test → prod behind an approval. Software engineering discipline, applied to BI.
- Power BI (PBIP)
- Azure DevOps
- Azure Pipelines
- Tabular Editor · BPA
- PBI Inspector
- Deployment Pipelines
- Microsoft Fabric
- DAX
01 · The problem
Most Power BI lives as clickops: a .pbix binary passed around and edited live in a workspace, with no version history and no quality gate. A broken measure or a sloppy model reaches production before anyone notices — and there is no clean way to review, roll back, or reproduce a change.
I rebuilt the J&D sales report’s delivery the way software ships. The report is source-controlled as a .pbip project, every change is automatically validated against model and report best practices, and it is promoted through isolated environments behind a human approval — reviewable, reproducible, and safe to release.
02 · Architecture
Author
Power BI Desktop
report saved as a .pbip project — datasets & reports as plain-text files
Version control
Azure DevOps Git
PBIP committed to the dev branch — every change is a diff, not a binary
Validate
pipeline on every commit
- Gate 01 — dataset & model rules Tabular Editor · Best Practice Analyzer — flags model anti-patterns before they ship
- Gate 02 — report rules PBI Inspector — checks report pages against layout & best-practice rules
Trusted branch
main
the PR merges only when both gates pass — main is the source for release
Source
main
only validated changes land here
Development
dev workspace
build & iterate
Test
test workspace
validate on production-like data
Production
prod workspace
live for the business
03 · How it works
-
Report as code
Saved in the .pbip format, the report’s model and pages are plain-text files — so they branch, diff, and pull-request in Azure DevOps Git like any other code, instead of living as an opaque .pbix binary.
-
Automated quality gates
Every commit to dev runs a validation pipeline: Tabular Editor’s Best Practice Analyzer checks the model and measures, PBI Inspector checks the report pages. A pull request can’t merge to main until both gates are green.
-
Promoted, not republished
Once on main, Power BI Deployment Pipelines promote the same report through isolated Development, Test, and Production workspaces — so changes are tested in a production-like setting before anyone sees them live.
-
A human before production
The step into Production is gated by a Release Manager approval — deliberate oversight and compliance before a change goes live, not an automatic push.
04 · Proof
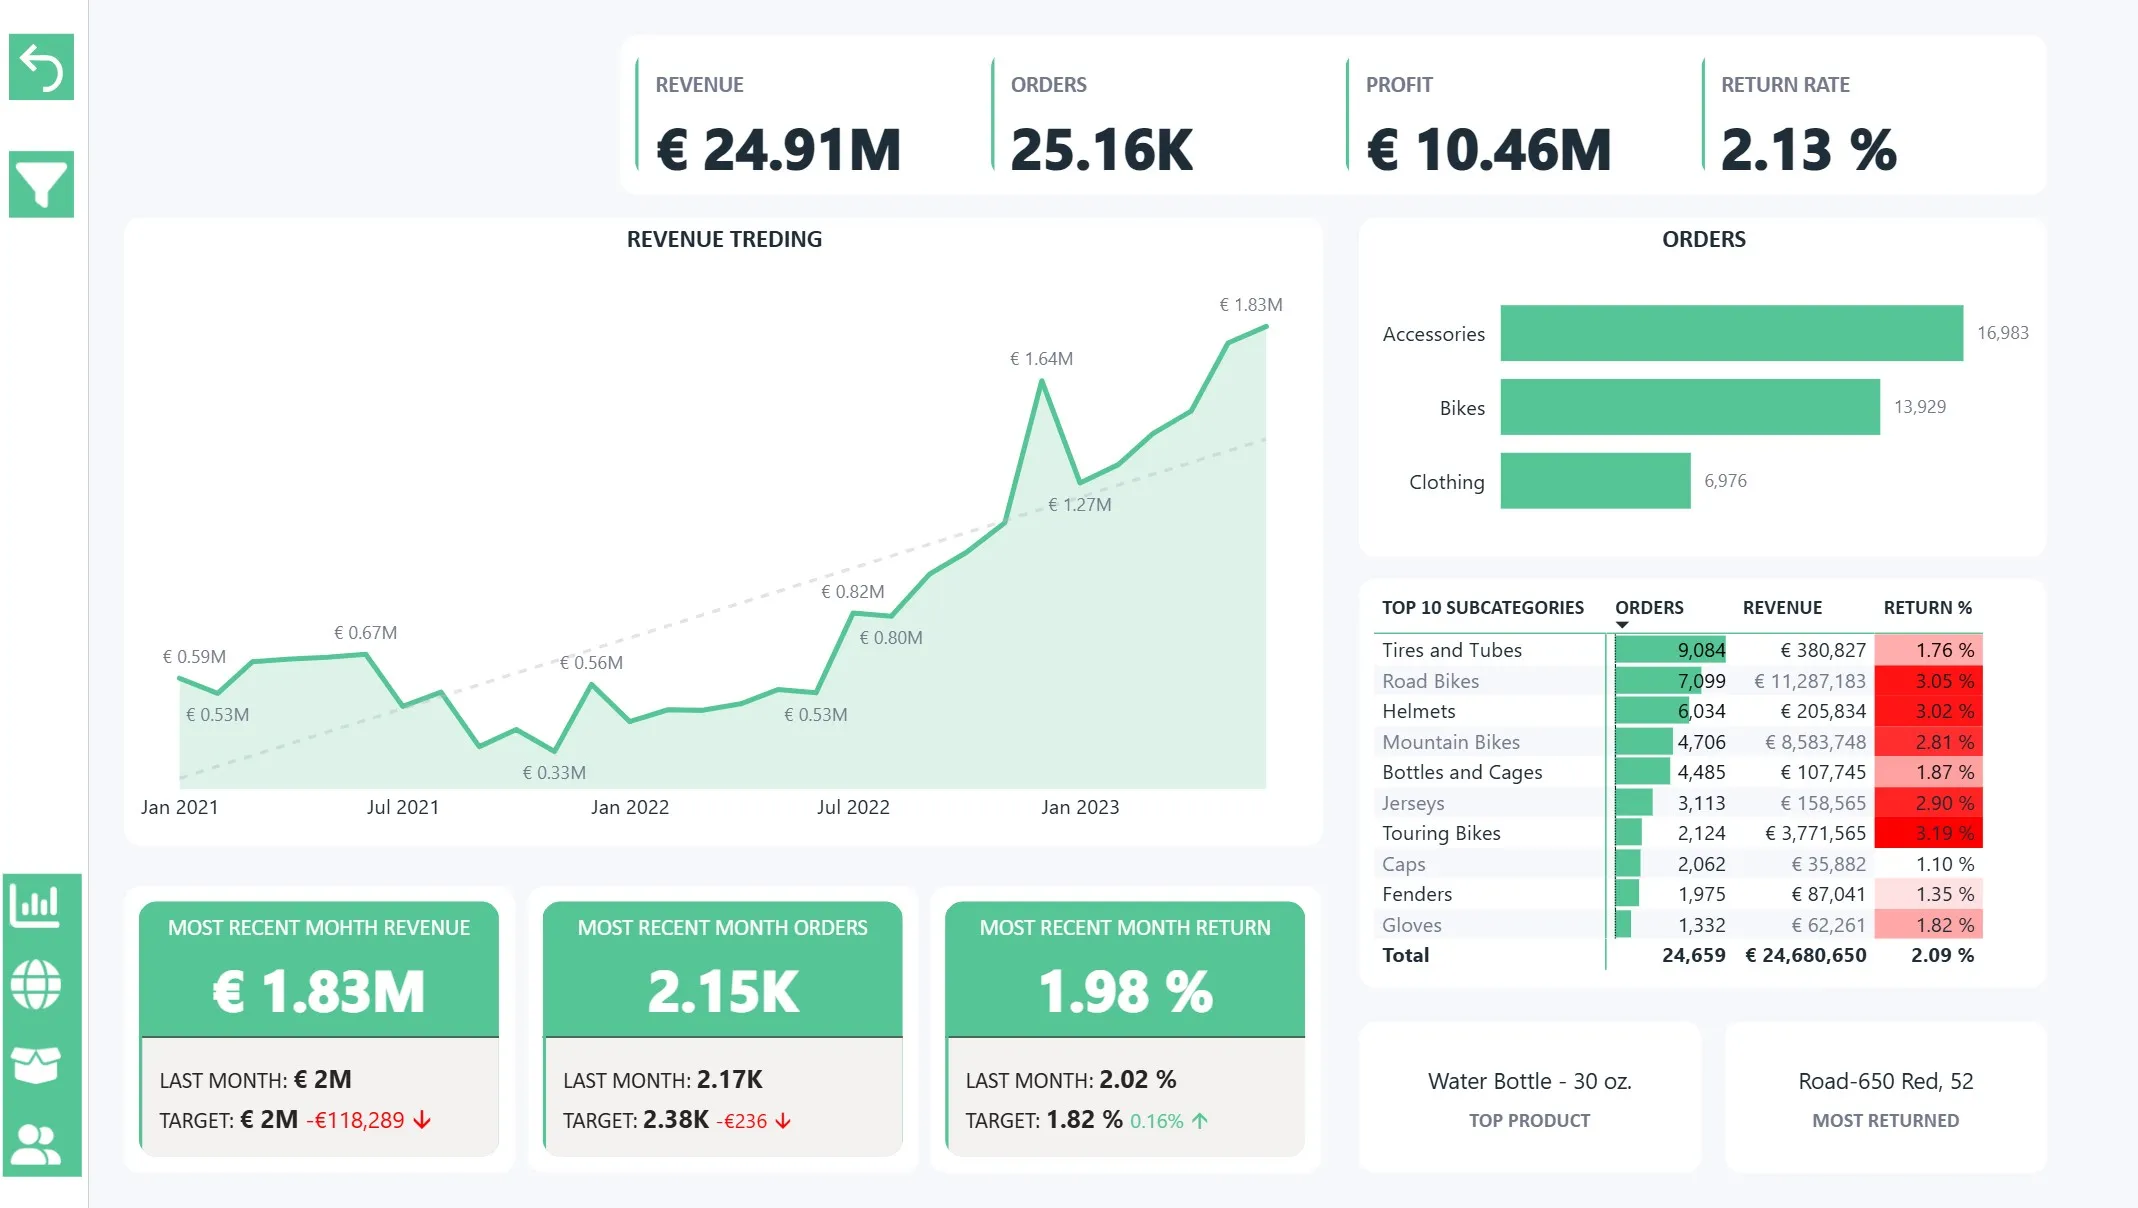
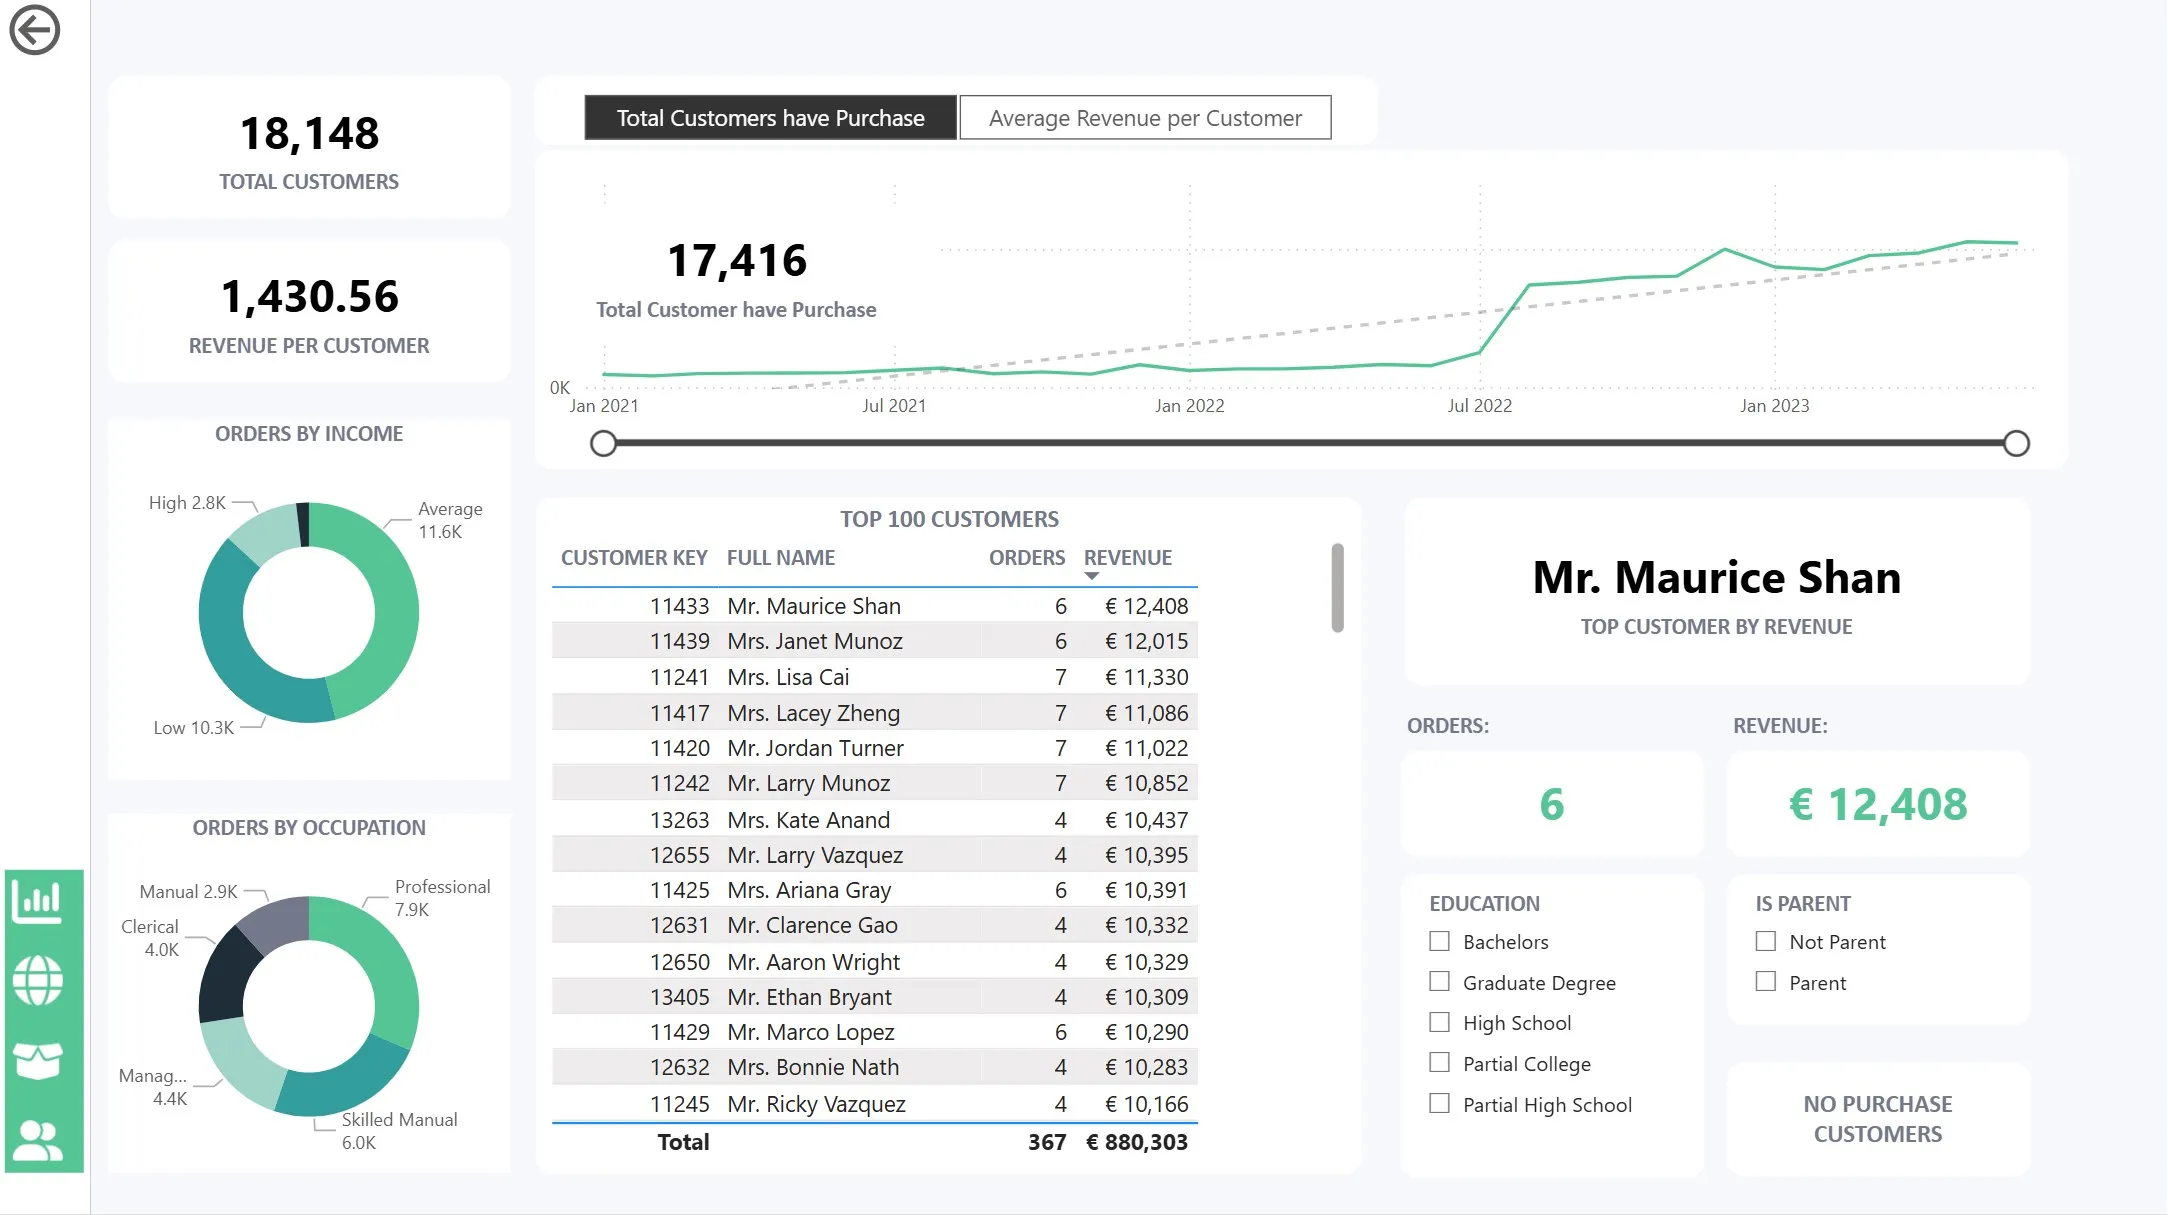
05 · Outcome
The result is a Power BI report you can trust like code: every change is versioned, automatically checked against model and report best practices, and promoted to production only after it passes validation and a person signs off — no more editing live in the workspace and hoping nothing breaks.
View the code Ask the assistant about this